FAAS · Actuarial modelling and mortality resilience
Will the premium last? Find out before the policy lapses.
An illustration assumes the same return every year. Markets don't deliver that, and the mortality table isn't your block either. FAAS runs every policy through thousands of market paths and mortality stresses. It shows the odds that coverage is still in force at the age that matters, and solves the premium that gets it there.
FAAS Studio asks for your FAAS serial number the first time it starts. Every download includes GridDaemon for worker machines. Mac: Apple silicon, macOS 13 or later. Linux: Ubuntu 24.04+ or Debian 13+.
- Native desktop studio
- Monte Carlo at block scale
- Parquet, PostgreSQL, SQL Server
- In active development
The gap
An illustration is one path. Your policyholders live on all of them.
Constant returns hide the risk
An 8% illustration and an average 8% are different policies. One bad sequence early on can drain the account value years before the illustrated lapse age.
The table isn't your block
Pricing tables carry loadings, and moving from the 2001 to the 2017 CSO table shifts charges by several percent. Then the insured lives arrive with their own health histories.
Spreadsheets run one policy at a time
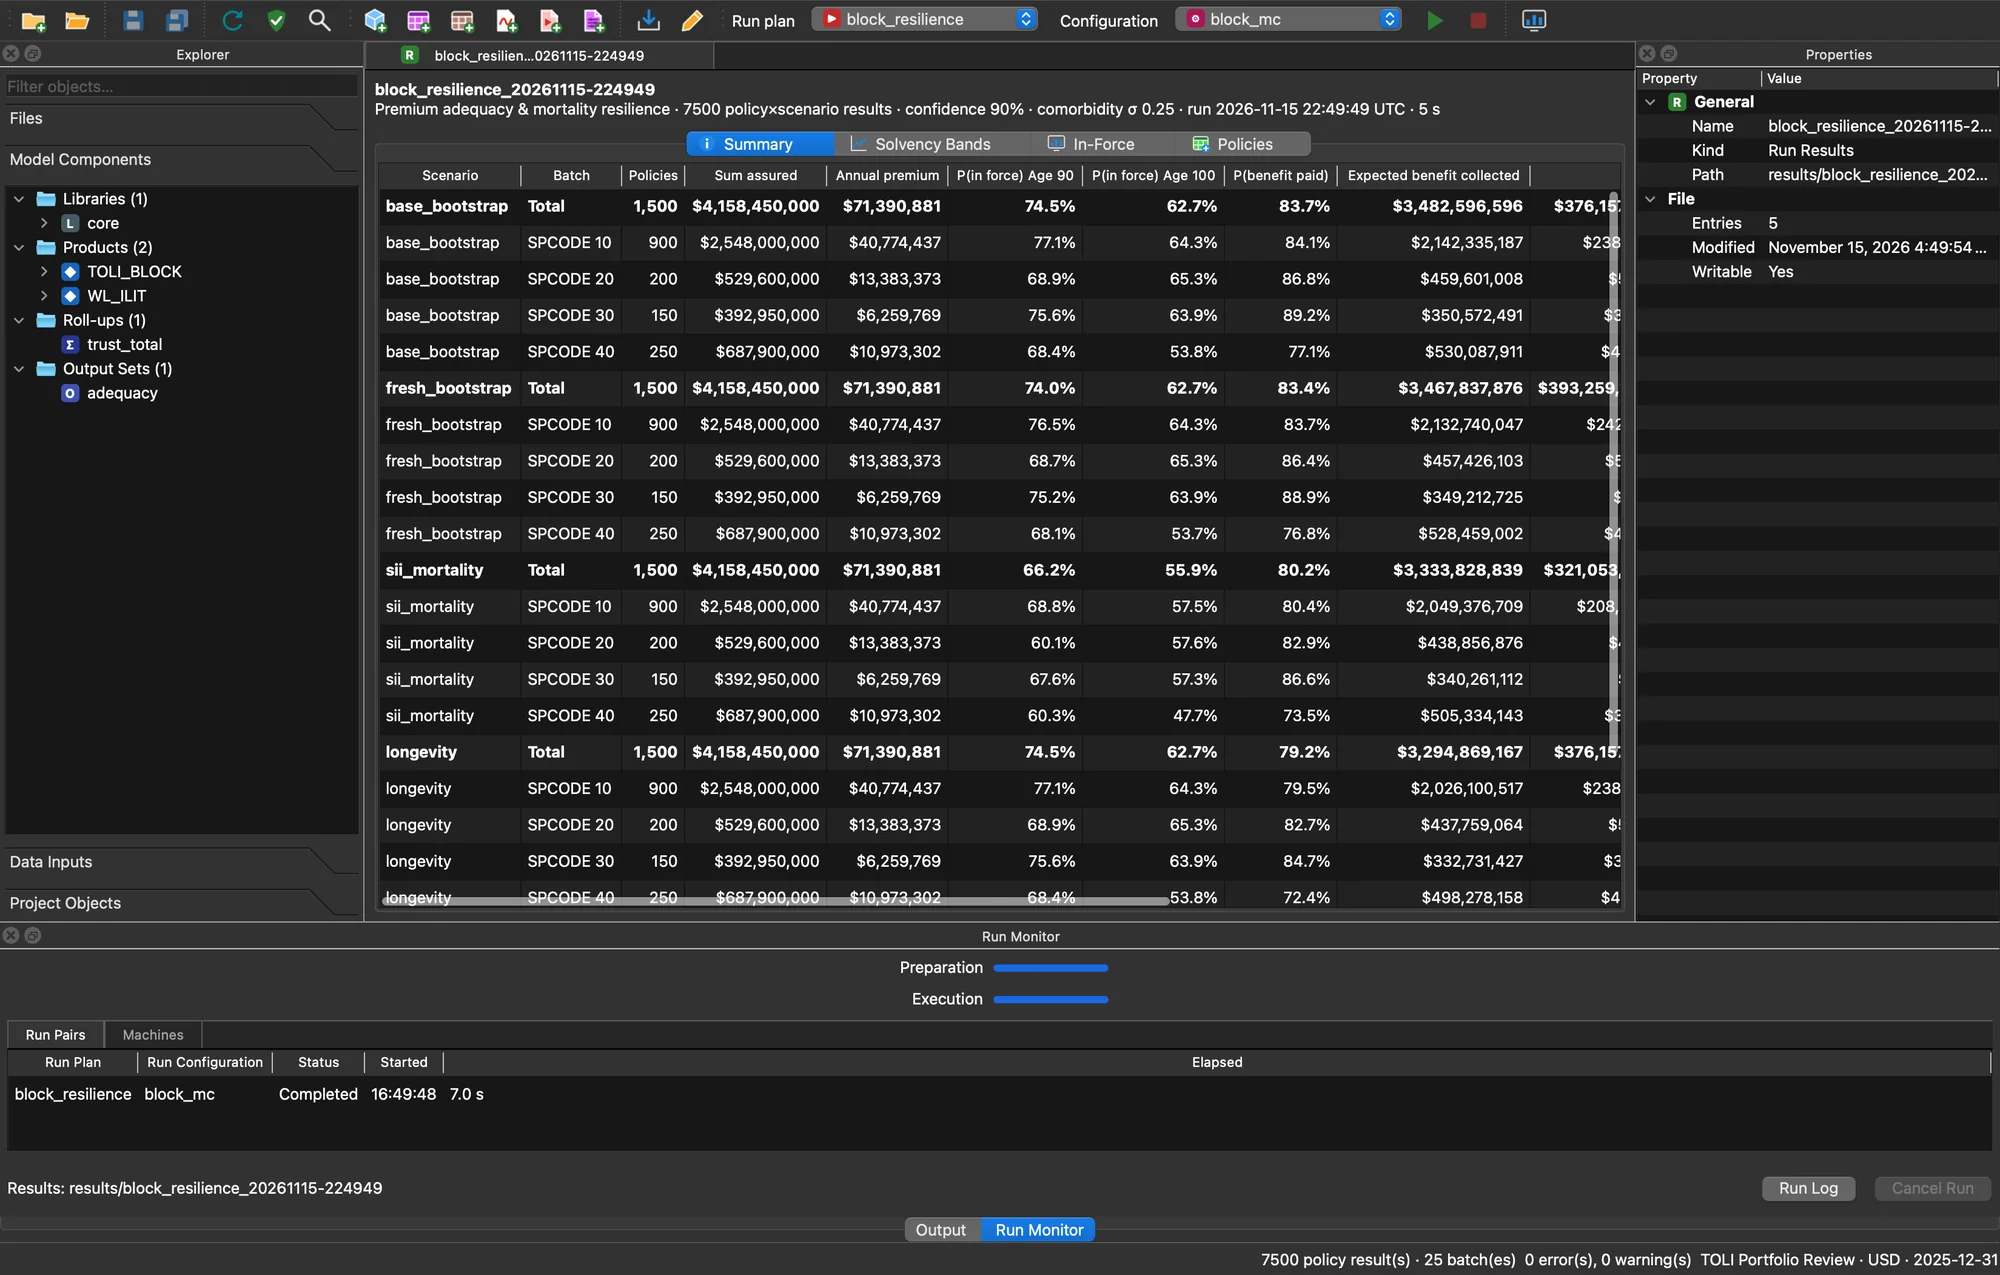
A workbook macro can price one case. It can't test 1,500 policies across five scenarios and a thousand trials, then hand an auditor a record of exactly what went in.
What you see
Answers by product code, scenario and confidence level.
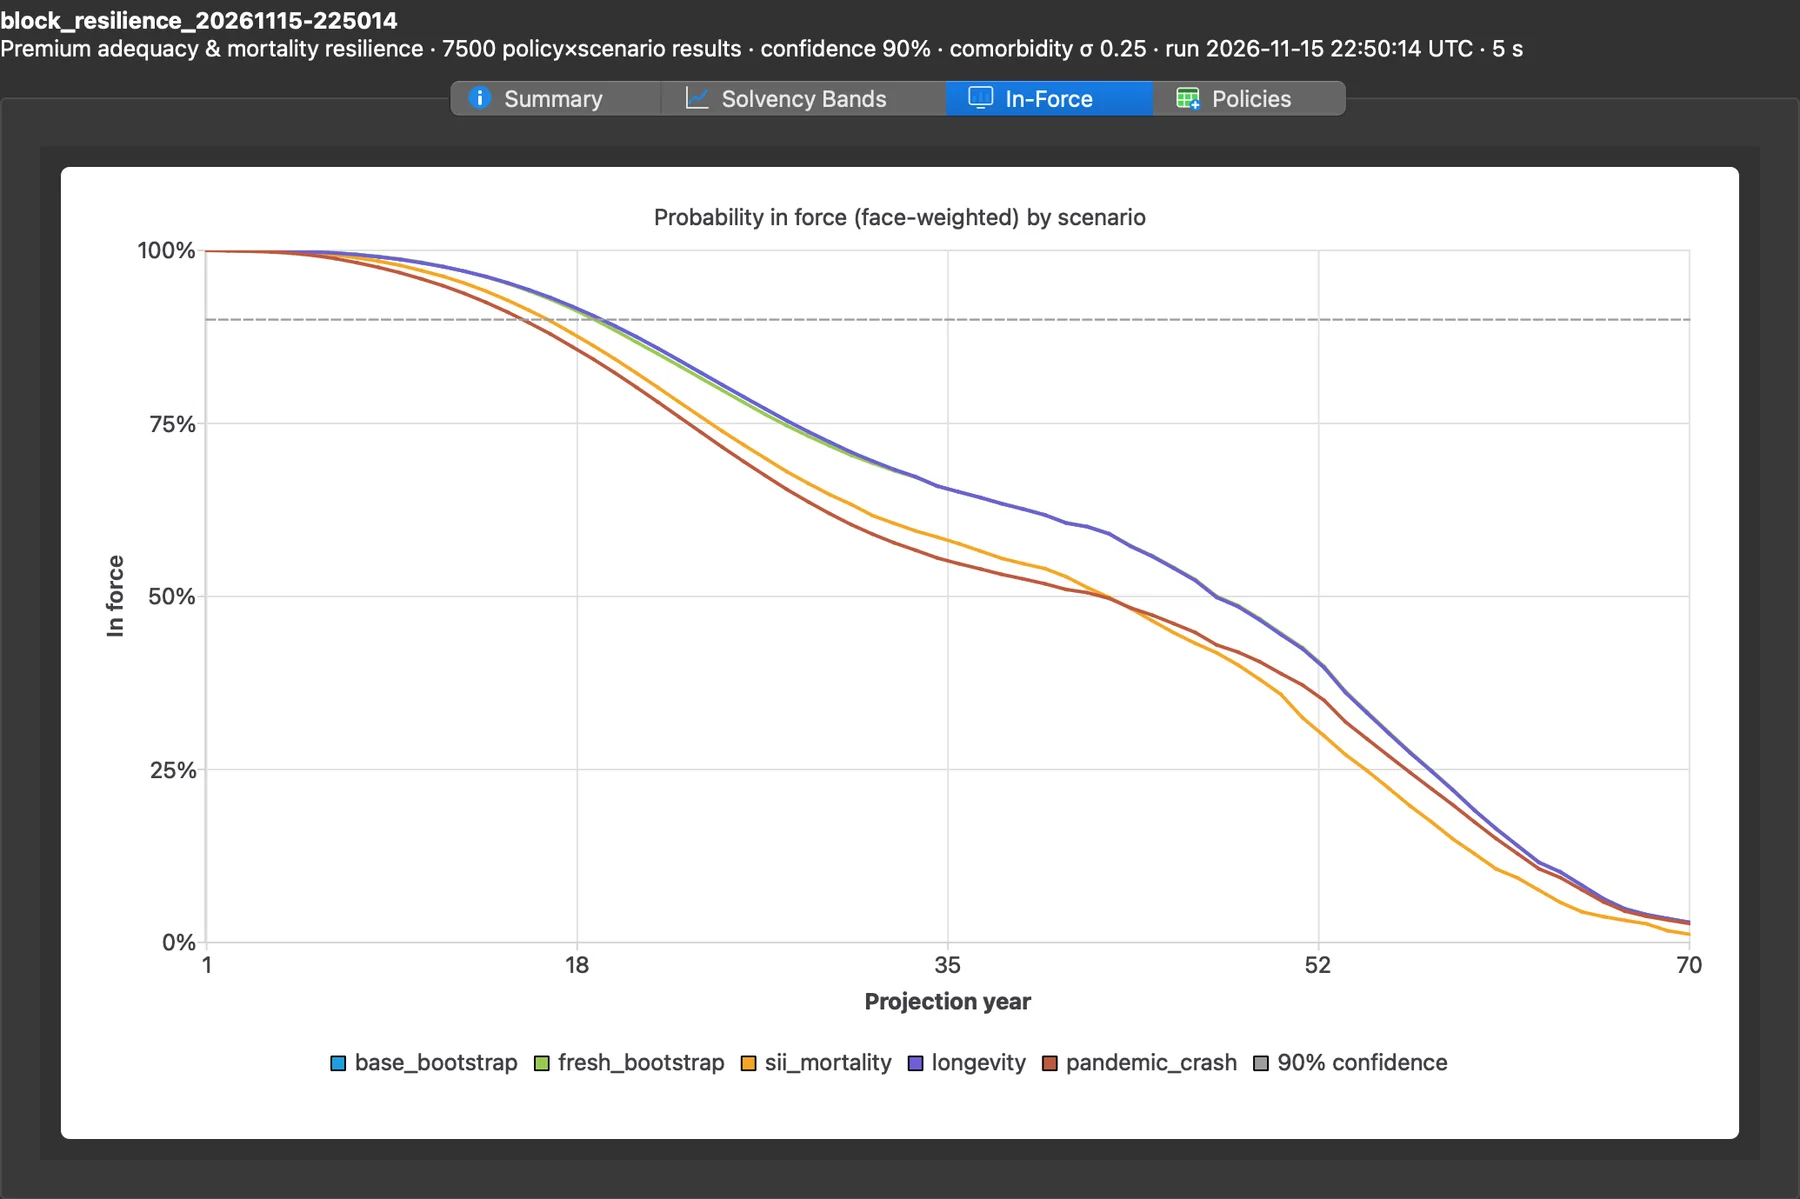
Probability in force, under every scenario
Watch how much of the block stays in force, year by year, under a base market, a fresh bootstrap, elevated mortality, longevity and a pandemic-with-crash scenario. Each line is weighted by face amount, so the policies that matter most count most.
Set testing points as a policy year or an attained age, such as life expectancy or age 100, and FAAS reports the probability of reaching each one.
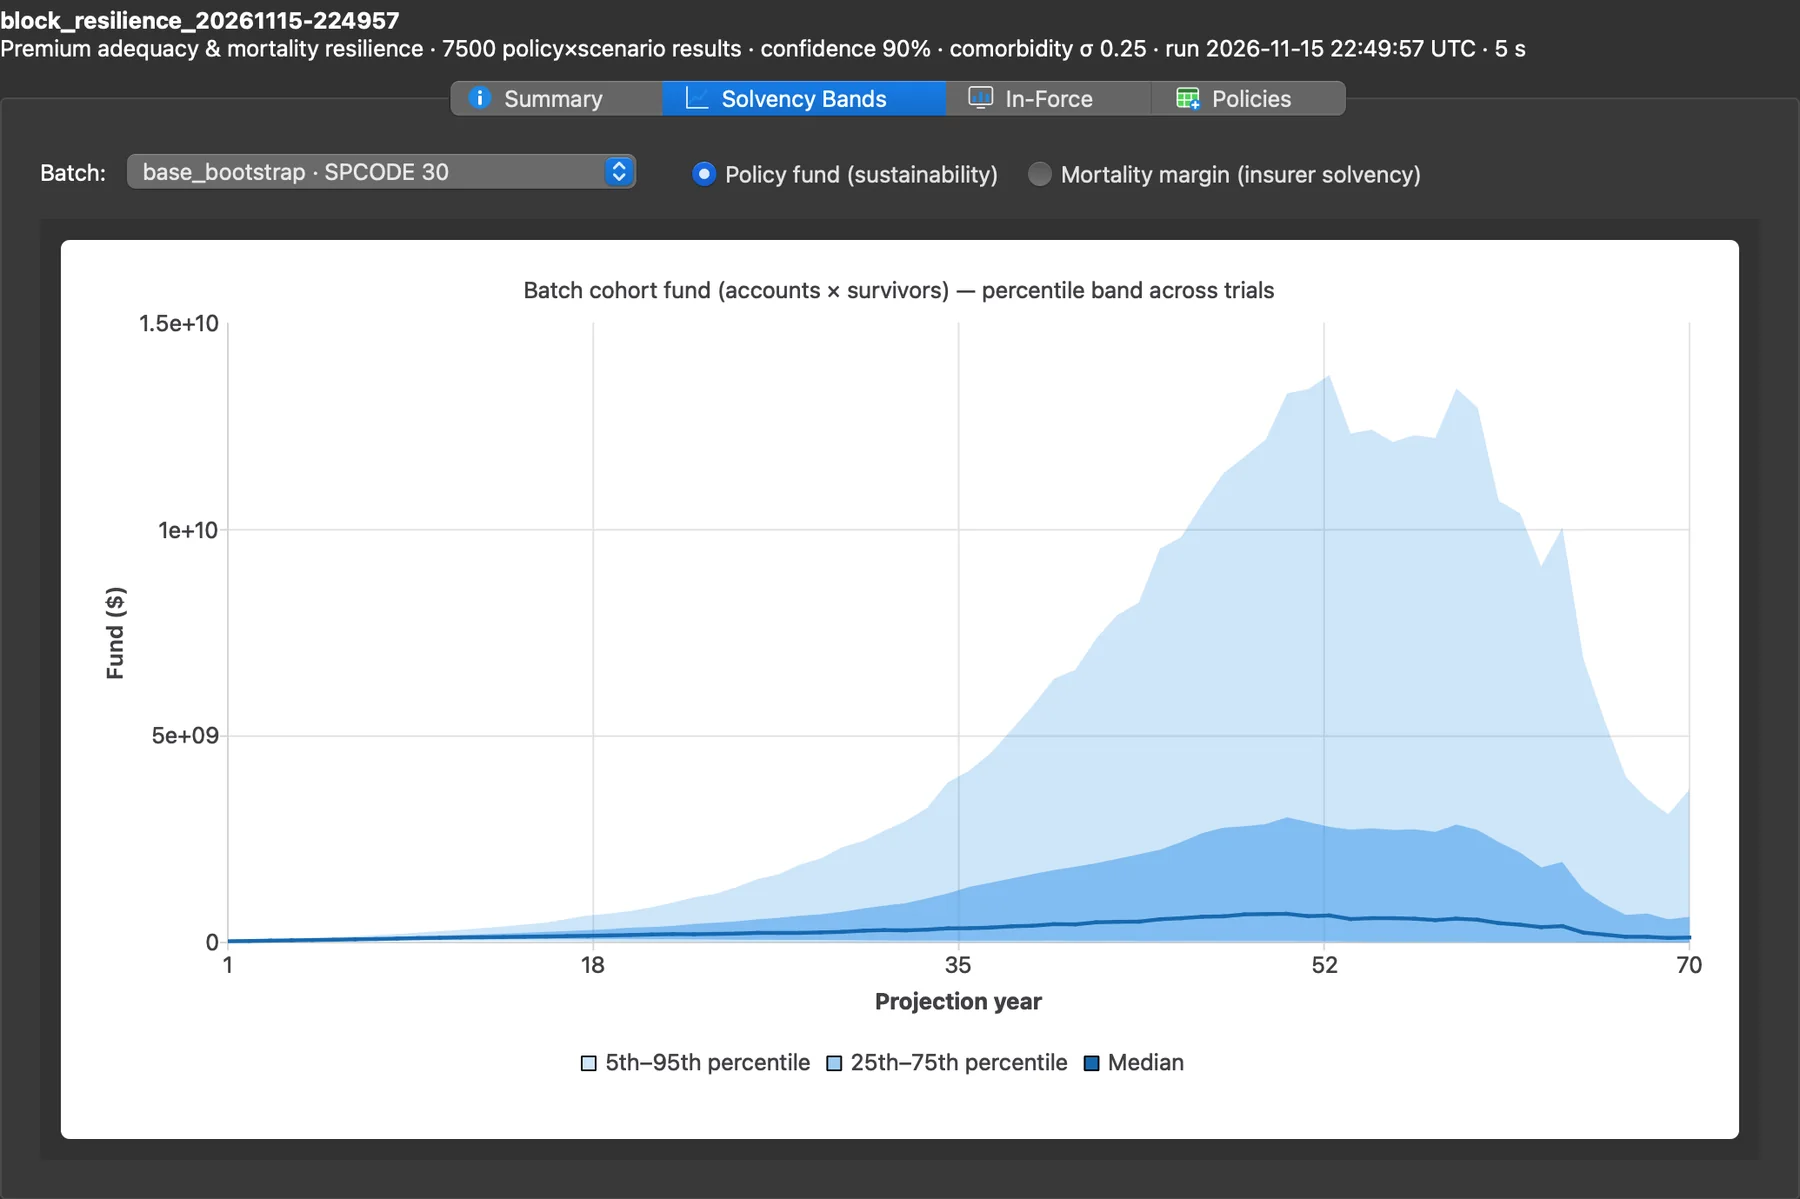
Solvency bands, not a single line
For every product code, FAAS charts the policy fund (account values times survivors) as percentile bands across all trials. The median tells you what's likely. The 5th percentile tells you what you need to survive.
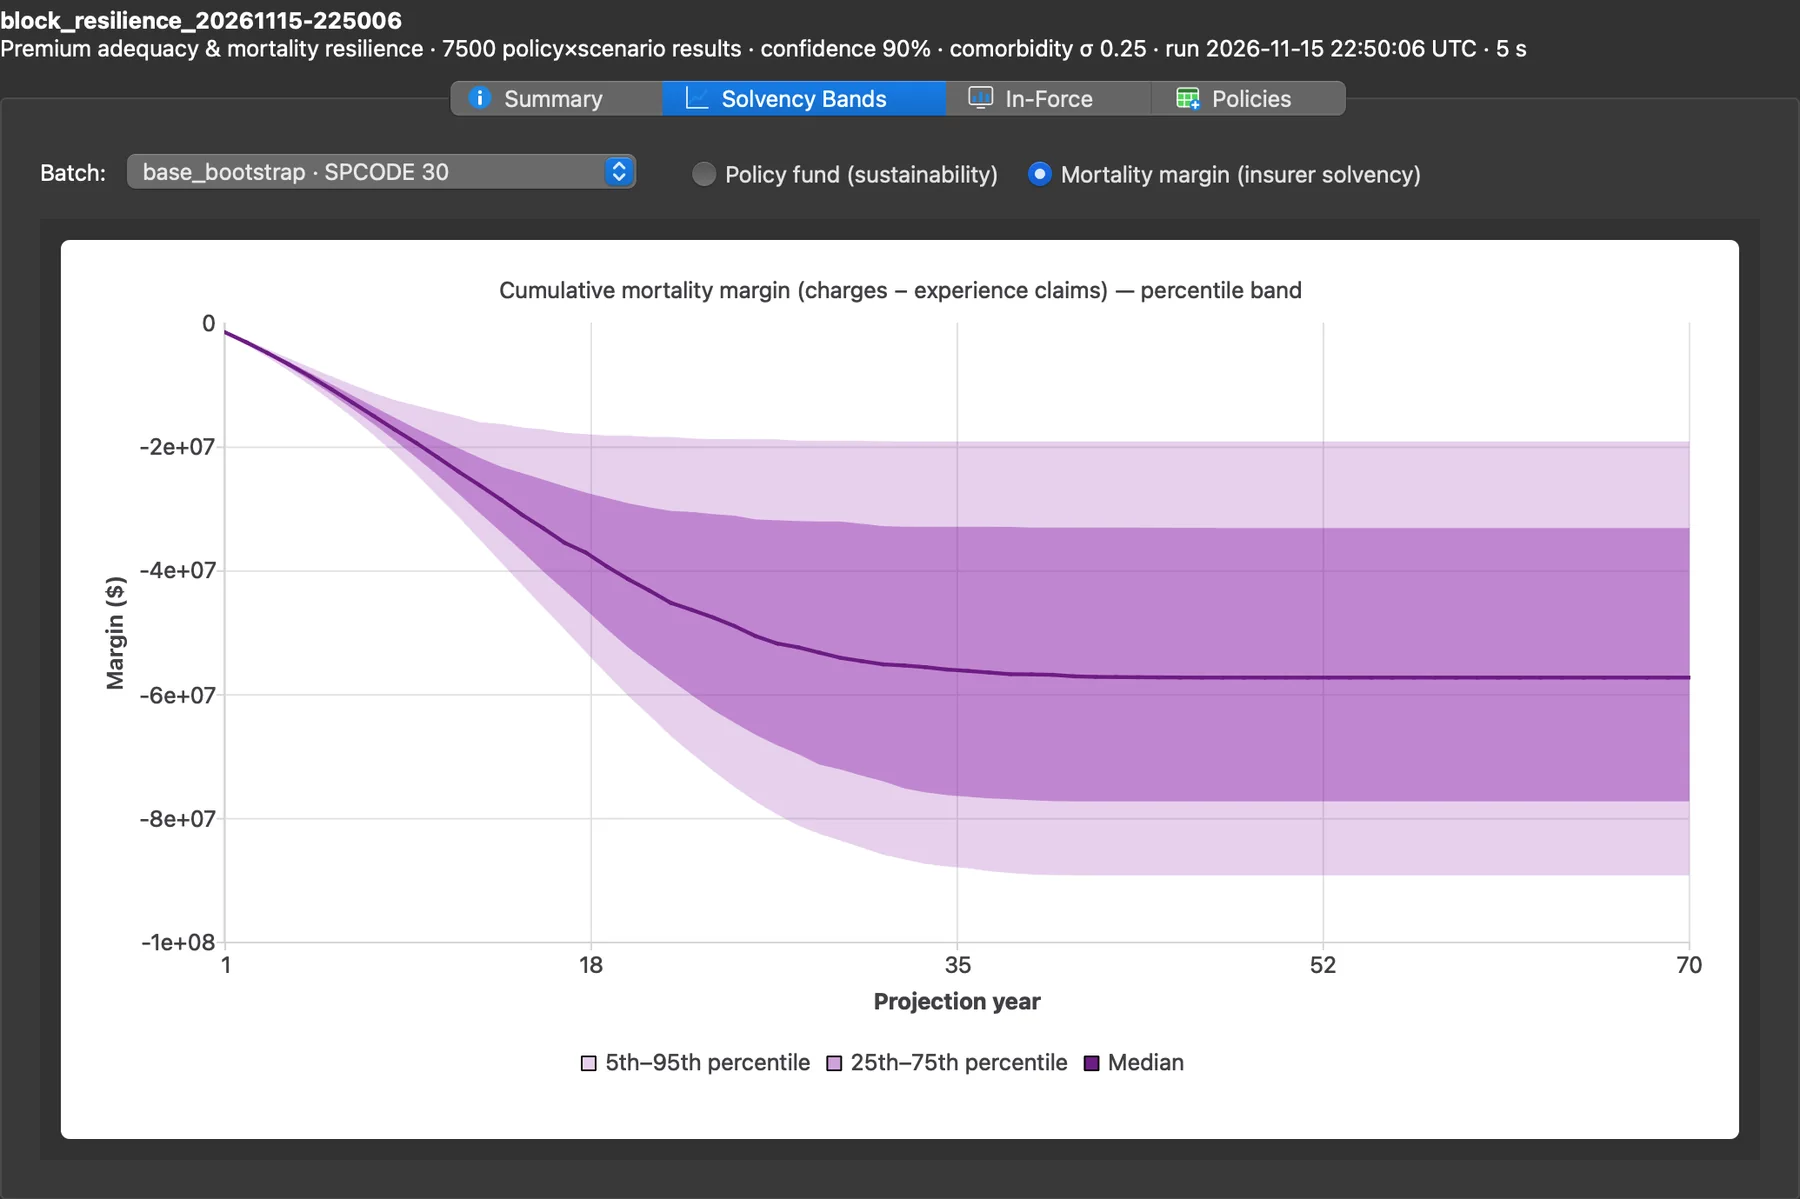
Mortality margin, from the insurer's side
Cost-of-insurance charges are priced on one basis; claims arrive on another. FAAS tracks the cumulative difference by product code, so you can see which block is quietly losing money, and by how much, under uncertainty.
In this illustrative block, one product code runs a median shortfall of about $57 million while another stays positive. A single average would have hidden both.
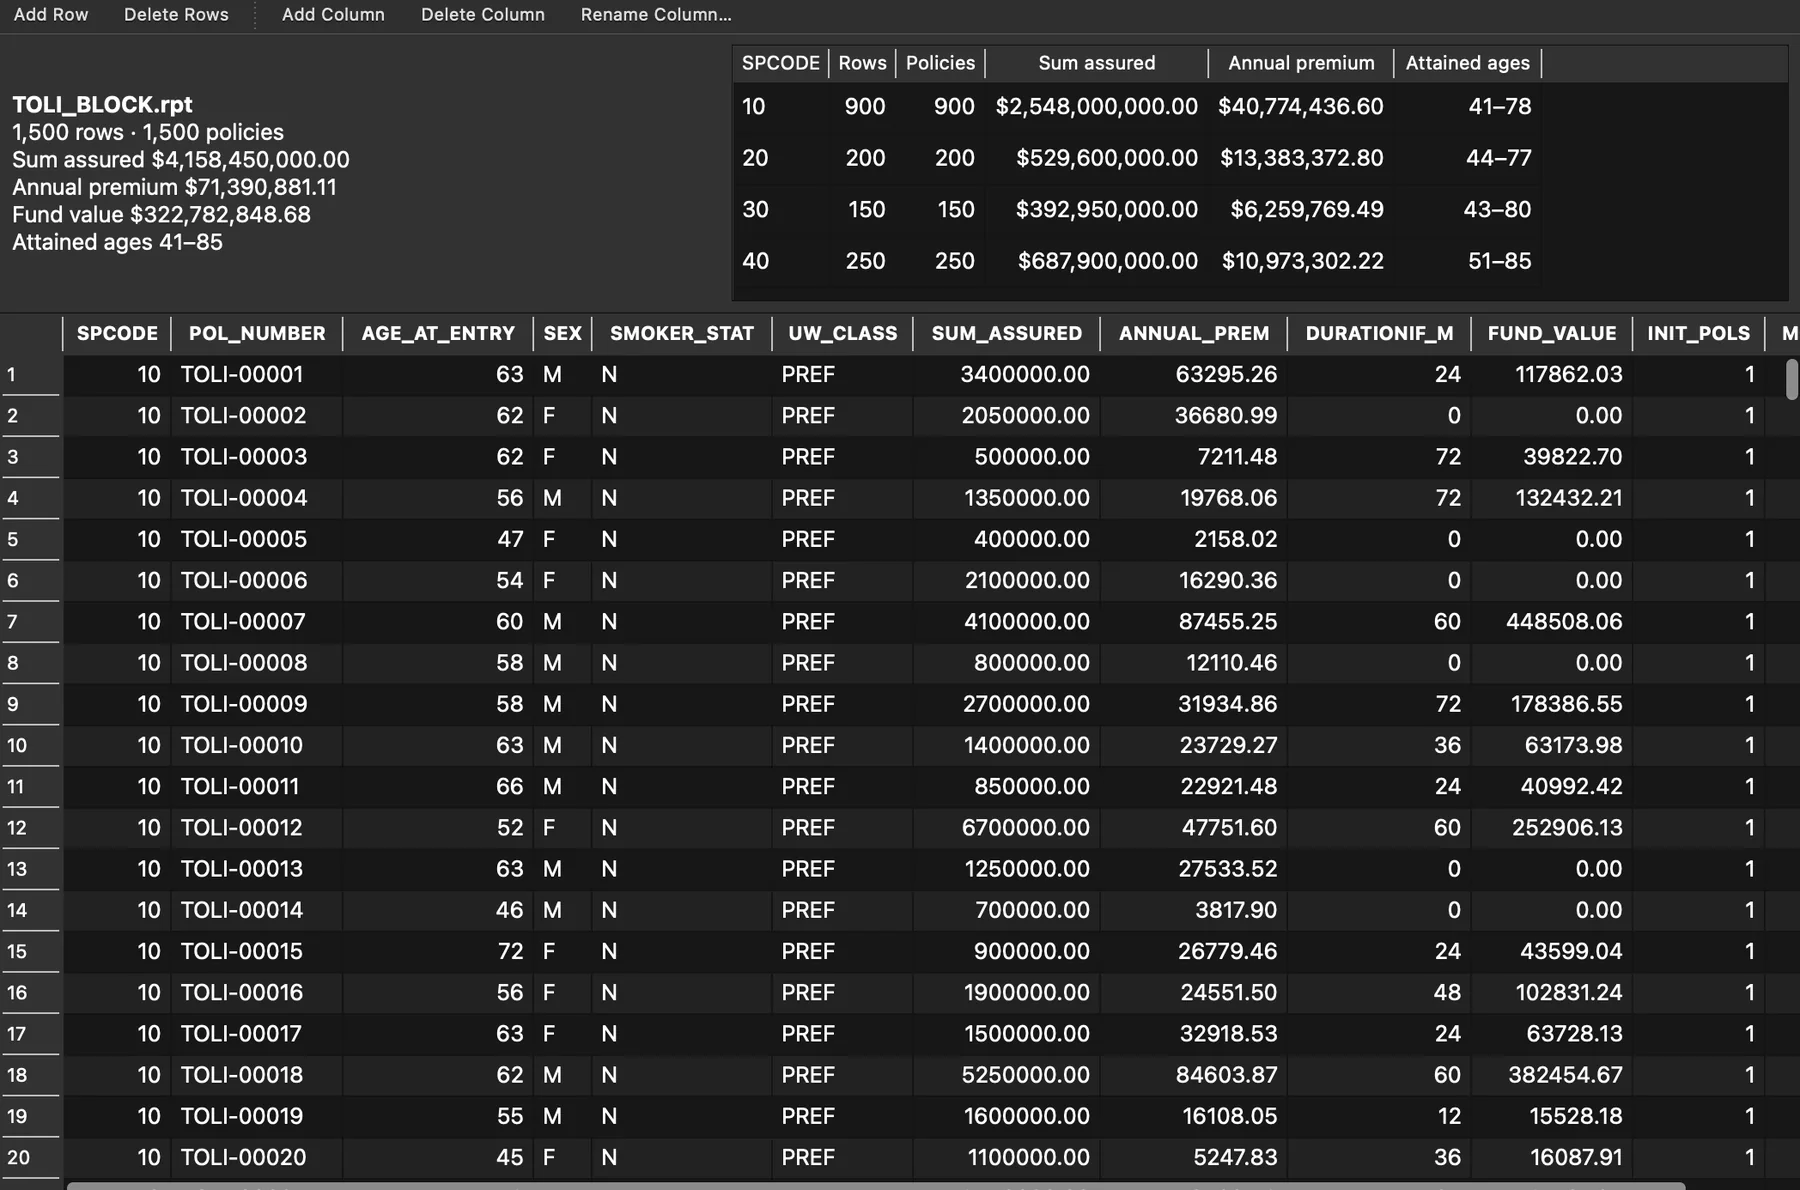
Your block, the way you already store it
Open model point files in the RPT and CSV formats actuarial teams already use. FAAS validates them and summarizes each product code, and writes them back without losing a field.
Each policy can carry its own comorbidity factor, with a default per product code for everything else.
Under the hood
Built for the questions actuaries get asked next.
Reproducible Monte Carlo
A counter-based random number generator means the same seed gives the same answer, whatever the number of cores.
Block-scale speed
7.5 million policy-trials in about a second on a 10-core laptop, using every core.
Premium solver
Finds the premium that keeps each policy in force to each testing point at your chosen confidence, such as 90%.
Comorbidity uncertainty
Experience mortality can differ from the pricing basis by an uncertain factor, drawn per trial, so the bands reflect what you don't know.
Mortality stresses
Level shocks, age-band shocks, catastrophe years and improvement, applied to charges, experience or both.
Results where you need them
Every run writes Parquet tables and can load PostgreSQL or SQL Server in one transaction. Re-running replaces the run instead of duplicating it.
An audit trail by default
Each run records its inputs with SHA-256 fingerprints, plus the seeds, version and who ran it.
No secrets in project files
Database passwords come from the environment or integrated sign-on. A connection string with a password in it is refused.
Checked, not assumed
Tested against the actuary's own workbook.
FAAS's engine is tested against a working actuarial workbook and reproduces its results exactly, including the solved premiums. Actuarial input from Gary Flotron (UMSL) shaped what it measures and why.
- Acceptance tests built from the original workbook's inputs and outputs
- Every run's results folder can be traced back to the exact inputs
- Same project, same seed, same numbers
- Runs on your machines; your policy data never leaves them
Roadmap
Shipped, and coming next
- 01 · Shipped
Grid workers
Spread a run across worker machines over encrypted connections. A grid run returns exactly the same numbers as a run on one machine.
- 02
Illustration view
Cash value, net amount at risk and cost of insurance, side by side under constant and stochastic returns.
- 03
Asset allocation
Equity and bond mixes inside each scenario, so allocation becomes a lever you can test.
- 04
Governance
Assumption versioning, review and sign-off before a run's results are used.
See it on a block like yours.
Tell me what you're pricing or testing, and I'll show you FAAS on an illustrative block shaped like it.